
Workspace Layout
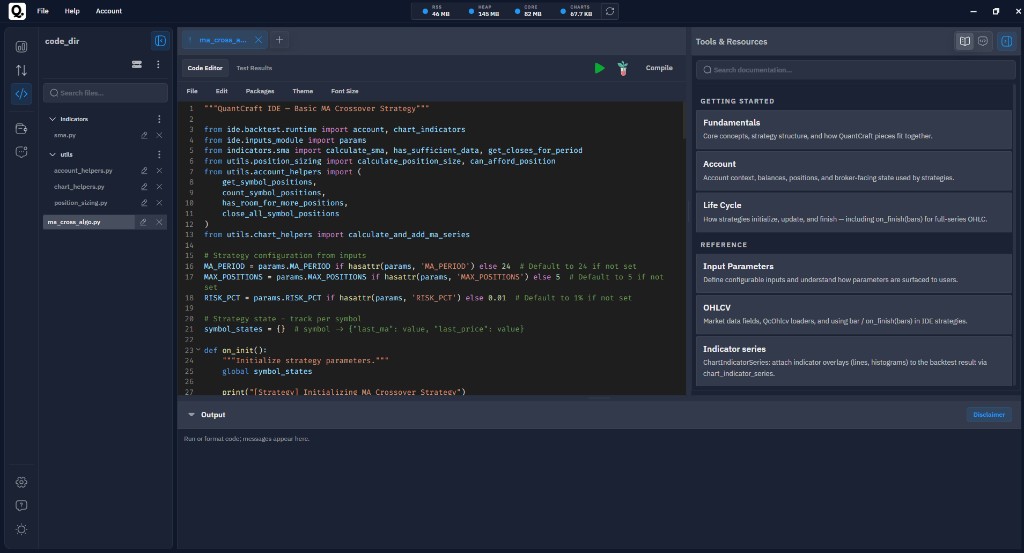
The QuantCraft IDE is the home for writing, running, and testing your trading strategies. It is organized as a single full-window workspace made up of four main regions that you can resize, expand, or collapse to fit how you work.
At a glance:
- Files Sidebar — your project files and folders
- IDE Main Panel — the Python editor, view tabs, and Run / Test / Compile controls
- Output panel — console output, plots, and backtest progress
- Tools & Resources Sidebar — in-app documentation (see also this site’s Reference) and QuantCraft AI
1. Files Sidebar (left)
The Files Sidebar is where you manage everything inside your workspace folder.
Header
- The sidebar header shows the name of your linked workspace folder. If you have not picked one yet, it just reads Files.
- Hover the title to see the full folder path in a tooltip.
- Use the collapse / expand button to shrink the sidebar to a thin vertical strip (the workspace name still shows vertically) or expand it back to its full width.
Toolbar
Just below the header you'll find:
- Workspace Folder button — open the workspace dialog to pick where your project files live, or load an existing project from a folder on disk.
- Three‑dot actions menu — quick access to:
- New File — creates a new file at the workspace root.
- New Folder — creates a new folder at the workspace root.
If no workspace folder is linked yet, the New File / New Folder actions are disabled and a tooltip explains why.
Search box
A search field filters the file tree as you type. Matching folders and files stay visible; everything else is hidden. Click the × to clear the search.
File tree
- Folders show as expandable nodes — click a folder to show or hide its contents.
- Click any file to open it in the editor.
- Hover a row to reveal inline actions: rename, delete, and (for folders) add a sub‑file or sub‑folder.
- The active file is highlighted so you can always see what you are editing.
Empty states
- No workspace yet — you'll see a short prompt asking you to pick a workspace folder using the workspace button.
- No search matches — a "No matches" message appears under the search box.
2. IDE Main Panel (center)
The center of the workspace is where you actually work. It's stacked top-to-bottom into:
- The tab strip
- The view switcher and run controls
- The editor toolbar
- The editor / Test Results area
Tab strip
- Every open file gets its own tab across the top.
- Click a tab to focus that file.
- Drag tabs to reorder them. The strip scrolls horizontally when you have lots of files open.
- Each tab has a small × to close the file (closing a tab does not delete the file from your workspace).
- The + button on the right end of the strip opens the New File dialog.
View switcher & run controls
When a file is open, this row gives you:
- Code Editor / Test Results tabs — flip the main panel between editing your code and viewing the latest backtest results for the active file.
- Run button — runs the current file as a regular Python script. Output streams into the bottom Output Panel.
- Test button — opens the Test (backtest) dialog where you choose date range, symbols, and optimization options.
- Compile button (only for
.pystrategy files) — saves a self‑contained runnable bundle of your strategy to disk for later use. - While a backtest is in progress, a spinner and Stop button appear here so you can cancel the run.
Editor toolbar
When you're in Code Editor view, a thin toolbar above the editor exposes:
- File — Save As, Import Python files into the workspace, Export the workspace.
- Edit — Undo, Redo, Cut, Copy, Paste, Find, Replace, Format Document.
- Packages — manage extra Python packages available to your strategies and add new ones.
- Theme — pick the editor color theme.
- Font Size — pick the editor font size.
Theme and font‑size choices are remembered between sessions.
Editor / Test Results area
- Code Editor — a full code editor with syntax highlighting, find/replace, formatting, and undo/redo.
- Test Results — shows the structured results of the last backtest for the active file: performance summary, charts, trade history, and (for optimizations) a sorted list of runs you can drill into.
Empty states
- No workspace folder — instead of an editor, you'll see a prompt explaining how to pick a workspace folder from the Files Sidebar.
- Workspace ready, no file open — you'll see "Open a file from the sidebar or use + to create a new file."
3. Output Panel (bottom)
The Output Panel sits underneath the editor and is shared by all files.
- Header — click the title (or the arrow) to expand/collapse the panel.
- Progress bar — while a backtest is running, a live progress bar shows either the current bar (single run) or the current run / generation (optimization).
- Error badge — if any errors have been logged, a red badge in the header tells you how many.
- Disclaimer button — opens an information dialog about how code is executed.
Inside the panel you'll see:
- Plain
print()output and runtime messages, time‑stamped. - Errors highlighted in red.
- Inline plots rendered directly in the panel — both Matplotlib images and interactive Plotly figures.
The panel auto‑scrolls to the latest output as new lines arrive.
Resizing
A thin horizontal divider sits between the editor and the Output Panel. Drag it up or down to change how much vertical space each gets. You can also focus the divider and use the Up / Down arrow keys to nudge it. Your size choice is remembered between sessions.
4. Tools & Resources Sidebar (right)
The right sidebar is your reference and assistant area. Its header reads Tools & Resources.
When expanded, two tabs let you switch between:
Documentation tab
A built‑in documentation browser with topics covering the QuantCraft runtime, fundamentals, indicators, input parameters, lifecycle, account, and more — so you can look things up without leaving the IDE. This website’s Reference page lists how those map to these articles.
QuantCraft AI tab
The QuantCraft AI chat assistant understands your workspace. Use it to:
- Ask questions about your code
- Get help writing or fixing strategies
- Connect external model API keys
- Manage multiple chat conversations
Resizing & collapsing
- A vertical divider between the editor area and the right sidebar lets you drag to resize the sidebar. You can also focus the divider and use Left / Right arrow keys to nudge it.
- The expand / collapse button in the sidebar header shrinks the panel to a thin vertical strip showing only the label.
Putting it all together: navigation tips
- Maximize editor space — collapse the Files Sidebar and the Tools & Resources Sidebar; collapse the Output Panel when you don't need it.
- Compare code and results — use the Code Editor / Test results view switcher above the editor; results are kept per file, so switching files shows you that file's last run.
- Keep an eye on long backtests — even if you switch to another file, the progress bar stays visible in the Output panel header and the backtest controls show a Stop button.
- Find things fast — use the search box in the Files Sidebar to filter the tree, and Find / Replace in the Edit menu to search inside the current file.
- Your layout is remembered — sidebar widths, the Output Panel size, the editor theme, and the font size are saved automatically and restored next time you open the IDE.