
Running Code
The QuantCraft IDE gives you three ways to execute the file you’re editing (workspace), each with a specific purpose:
| Button | What it does | When to use it |
|---|---|---|
| Run | Executes the current file as a regular Python script. | Quick checks, prototyping, printing values, sanity-checking helpers, generating ad-hoc plots. |
| Test | Starts a backtest of your strategy. | Evaluating a strategy on historical data, single runs, parameter sweeps, or genetic optimization. See Backtests. |
| Compile | Builds a runnable bundle of your strategy that you can attach to charts later. | Preparing a finished strategy to run against charts outside the IDE. |
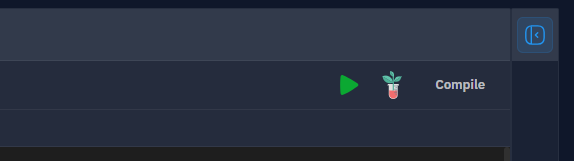
All three buttons sit in the top-right of the editor area when a file is open. Run and Test are always available for any file; Compile appears for .py files that match the QuantCraft strategy template.
Quick run (the Run button)
The Run button is the simplest way to execute code: it runs the file you are looking at, top to bottom, like a plain python myfile.py.
How to run
- Open the file you want to run in the editor (it doesn’t need to be a strategy — any
.pyfile works). - Click Run in the toolbar above the editor.
- The first time per session, you’ll see the Disclaimer dialog (see below). Click I understand to continue.
- Output streams into the Output Panel at the bottom of the workspace as it’s produced.
While code is running, the Run and Test buttons are disabled to prevent overlapping runs.
What gets executed
- The active file is the entry point.
- Any other files and folders in your workspace are made available so you can
importthem from the running file (workspace folders work like Python packages —from my_folder import my_module). - Code runs against the QuantCraft IDE Python environment (Dependencies), so any package listed under Packages (including ones you added) is importable.
What works inside Run
print(...)and anything written to stdout / stderr appears live in the Output Panel (errors are shown in red).- Matplotlib figures (
plt.show()-style plots) are rendered as images inline in the Output Panel. - Plotly figures are rendered as interactive charts inline.
- The script can use the standard library, third‑party packages from your environment, and your own workspace modules.
When not to use Run
Run executes plain Python — it does not drive the QuantCraft backtest engine. If your file relies on the strategy callbacks on_init, on_bar, and on_finish, those will not be called by Run; use Test instead (Strategy lifecycle).
Output
Wherever your code prints, plots, or errors, the Output Panel at the bottom of the workspace is where you’ll see it.
What you’ll see
- Time-stamped log lines for everything written to
stdout. - Errors in red for anything written to
stderr, plus a small error count badge in the panel header. - Inline plots — Matplotlib images and Plotly interactive charts.
(no output)if your script ran successfully but printed nothing.(exit code N)if the script ended with a non-zero exit code without writing an error.
Working with the panel
- Click the Output title (or the arrow next to it) to collapse / expand the panel.
- The panel auto-scrolls to the latest output as new lines arrive.
- The panel is shared across files — the next time you Run or Test, previous output is cleared so you start fresh.
- Use the divider above the panel to resize how much of the screen it takes.
Run and Test both write to this same Output Panel; Test additionally shows structured results in the Test Results view of the editor area.
Disclaimers
QuantCraft executes Python on your machine, using your user account. Before your first run in a session you’ll see a Disclaimer dialog explaining this in plain language.
What the disclaimer covers
- Code runs without sandboxing — scripts can read and write files you have access to, use the network, and start other programs (for example via
subprocess). - This is appropriate for local development with code you trust.
- You are responsible for code you run, packages you install, and data you send to external services.
The two ways it appears
- Run flow disclaimer — appears when you click Run (or Test). It includes a “Don’t show this again” checkbox. If you tick it before clicking I understand, future Runs and Tests will skip the dialog and execute immediately.
- Reference disclaimer — also reachable any time from the Disclaimer button in the Output Panel header. This version is read-only — closing it does not change your settings.
If you change your mind later and want the dialog to come back, clear your browser/app site data for QuantCraft (or use your usual app reset workflow) and the disclaimer will appear again on the next Run.
Run vs. Test vs. Compile — when to use which
Use this short guide to pick the right action.
Use Run when…
- You want to quickly execute a script and see what it prints or plots.
- You’re prototyping helpers, exploring data, or verifying that a calculation does what you expect.
- You’re writing a small utility script that isn’t a strategy at all.
- You want to print intermediate values while developing.
Run is the fastest feedback loop. It doesn’t simulate trading, doesn’t compute performance metrics, and doesn’t need a strategy template.
Use Test when…
- You want to backtest a strategy on historical data.
- Your file follows the QuantCraft strategy template (with
on_init,on_bar,on_finish). - You need structured results: equity curve, performance metrics, trade history, and charts.
- You want to sweep parameters (brute-force optimization) or run a genetic optimization to search for good parameter combinations.
When you click Test, the Backtest dialog opens so you can choose the symbol, date range, parameters, and (optionally) optimization settings. Test runs your strategy through a backtest subprocess (not the same path as plain Run) — the IDE sends configuration over a WebSocket and streams progress to the Output Panel. Results then appear in the Test Results view of the editor. You can Stop a long-running test at any time.
Use Compile when…
- You have a finished strategy that you want to attach to a chart (so it can run against live or recorded data outside the IDE).
- The file is a
.pystrategy that includes the required callbacks (on_init,on_bar,on_finish).
Compile packages the strategy together with the workspace modules it imports and the IDE packages it needs into a single runnable bundle file (*.qcraft.json) that you save to disk via the system file dialog. The bundle does not run by itself — it is meant to be attached to a chart to drive a strategy from there.
If the Compile button is disabled, the file is missing one of the required strategy callbacks. Add
def on_init():,def on_bar(...):, anddef on_finish():(or use the default strategy template) to enable it.
Tips
- Stop a long run — When a backtest is in progress, a Stop button appears next to the Run/Test controls. Plain Run scripts can be ended by closing the file or interrupting the backend.
- Where did my output go? — The Output Panel is shared between Run and Test. If you switched between them, scroll up in the panel; the latest run’s output is at the bottom.
- Importing other files in the workspace works for Run too — both Run and Test see your workspace as a package tree, so the same
importstatements behave consistently in either. - Compile before sharing — If you want to use the strategy on a chart, always Compile after your last edit so the bundle reflects your latest code.